Case Example 3: Excess Weight Gain
Brady is an 18-month-old boy. Brady's mother, Rae, works outside the home. Brady is cared for by his grandmother during the day when Rae is working. Brady has been formula-fed since birth. He was about 5 months old when he began eating solid foods.
Brady has been seen by his health care provider regularly since birth (date of birth: April 8, 2009). His weight and length have been recorded and plotted on a growth chart at each visit.
Brady's measurements are as follows:
| Date | Age (months) | Weight (pounds) | Length (inches) |
|---|---|---|---|
| 5/8/2009 | 1 | 8.0 | 20.5 |
| 7/8/2009 | 3 | 13.5 | 23.75 |
| 10/7/2009 | 6 | 18.5 | 26.0 |
| 1/6/2010 | 9 | 22.5 | 28.25 |
| 4/5/2010 | 12 | 26.75 | 29.5 |
| 10/7/2010 | 18 | 31.0 | 32.25 |
Comparing Weight-for-Age Plotted on the WHO and CDC Growth Charts
Measuring and recording weight-for-age is important in early infancy. It helps health care providers monitor each child’s weight and track any changes in weight-for-length. Weight-for-age is not used to classify infants and children as underweight or overweight. It reflects body weight relative to age. It is influenced by recent changes in health or nutrition status.
Using the WHO Weight-for-Age Growth Chart
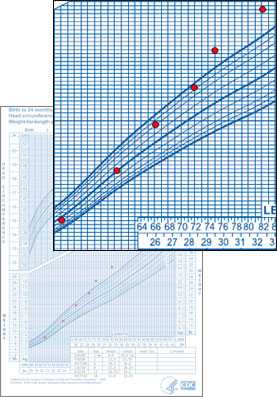
When Brady's weight is plotted on the WHO weight-for-age growth chart, his weight is below the 50th percentile for the first 3 months. At age 6 months, his weight-for-age begins moving upward across centiles. At 12 months, it crosses to above the 98th percentile, indicating that his weight is high for his age. Brady’s length-for age tracks below the 50th percentile on the WHO length-for-age growth chart.
See Brady's measurements plotted on the WHO weight-for-age and length-for-age growth charts.
Using the CDC Weight-for-Age Growth Chart
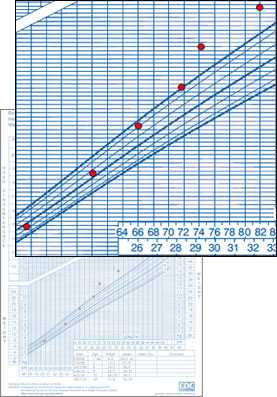
When Brady's measurements are plotted on the CDC weight-for-age growth chart, his weight starts below the 50th percentile at birth. It rises to above the 85th but less than the 95th percentile at age 12 months. At age 18 months, it crosses to above the 95th percentile. Brady’s length-for-age tracks along the 50th percentile on the CDC length-for-age growth chart.
See Brady's measurements plotted on the CDC weight-for-age and length-for-age growth charts.
| Comparing Weight-for-Length Plotted on the WHO and CDC Growth Charts | |
|---|---|
|
WHO Weight-for-Length Growth Chart |
CDC Weight-for-Length Growth Chart |
Using the CDC Weight-for-Length Growth Chart
When Brady's measurements are plotted on the CDC weight-for-length growth chart, his weight-for-length is around the 50th percentile at age 1 month. It begins an upward trend of crossing centiles at age 3 months, and it continues to above the 95th percentile at age 12 months.
Comment: When Brady’s health care provider plots his growth on both the WHO and CDC weight-for-length growth charts, there is a similar pattern of upward growth. However, the WHO weight-for-age growth chart identified high weight at an earlier age than the CDC weight-for-age growth chart (12 months versus 18 months).
While there are currently no evidenced-based guidelines for treating infants and children younger than aged 2 years with high weight, early recognition of a child's tendency toward obesity may help to trigger interventions to slow the rate of weight gain. Guidelines for the prevention, assessment, and treatment of child overweight and obesity indicate that weight loss is not recommended in this age group.
However, potential actions that can be used to prevent excess weight gain in all children starting at birth, include the following:
- Encourage mothers to exclusively breastfeed for about 6 months and continue breastfeeding after the introduction of solid food until age 12 months and older.1
- Practice responsive feeding methods such as the following:2
- For infants, recognize feeding cues like rooting and sucking, offer age-appropriate portions, and let infants self-regulate their intake.
- For toddlers and preschoolers, let them serve themselves when eating family style, offer age-appropriate portions, let them determine how much they eat, and reinforce their internal cues of hunger and fullness.
- Limit the intake of beverages sweetened with added sugars.1
- Encourage the consumption of diets with the recommended amounts of fruits and vegetables after age 6 months.1
- Limit the intake of energy-dense foods of low nutritional quality.1
- Use the following guidelines to transition to reduced-fat milk at age 1 year:
- From the American Academy of Pediatrics: “For children between 12 months and 2 years of age for whom overweight or obesity is a concern or who have a family history of obesity, dyslipidemia, or cardiovascular disease, the use of reduced fat milk would be appropriate.”3
- From the Expert Panel on Integrated Guidelines for Cardiovascular Health and Risk Reduction in Children and Adolescents: “Between the ages of 1 and 2 years, as children transition from breast milk or formula, reduced fat milk (ranging from 2% milk to fat-free milk) can be used on the basis of the child’s growth, appetite, intake of other nutrient dense foods, intake of other sources of fat, and risk for obesity and cardiovascular disease. Milk with reduced fat should only be used in the context of an overall diet that supplies 30% of calories from fat.”4
- Limit television viewing and other screen time.1,2
- Provide daily opportunities for infants and young children to be physically active under adult supervision.2 For example,
- For infants younger than 6 months, potential activities while awake can include time in the prone position and opportunities to move freely under adult supervision to explore the indoor and outdoor environments.
- For toddlers and preschoolers, potential activities can include a combination of developmentally appropriate, structured and unstructured physical activities under adult supervision.
References
1Barlow SE; and the Expert Committee. Expert committee recommendations regarding the prevention, assessment, and treatment of child and adolescent overweight and obesity: summary report. Pediatrics. 2007;120(suppl 4):S164-S192.
2Institute of Medicine. Early Childhood Obesity Prevention Policies. Goals, Recommendations, and Potential Actions. 2011. Accessed November 23, 2012.
3Daniels SR, Greer FR; and the Committee on Nutrition. Lipid screening and cardiovascular health in childhood. Pediatrics. 2008;122(1):198-208.
4Expert Panel on Integrated Guidelines for Cardiovascular Health and Risk Reduction in Children and Adolescents. Expert Panel on Integrated Guidelines for Cardiovascular Health and Risk Reduction in Children and Adolescents: summary report. Pediatrics. 2011;128:(suppl 5)S213-S256.
- Page last reviewed: April 15, 2015
- Page last updated: January 4, 2017
- Content source:


 ShareCompartir

