Interpretation
≥ 95th percentile | Obesity |
| 85th to < 95th percentile | Overweight |
| < 5th percentile | Underweight |
Interpretation of the plotted BMI-for-age is based on the established cutoff values previously shown.
These percentiles indicate the rank of BMI in a group of 100 children of the same sex and age from the reference population. For example, in a group of 100 children from the reference population,
5 children will have a BMI-for-age that is at or above the 95th percentile.
10 will have a BMI-for-age that is between the 85th and 95th percentiles.
5 will have a BMI-for-age less than the 5 percentile.
80 children will have a BMI-for-age that is within the normal range.
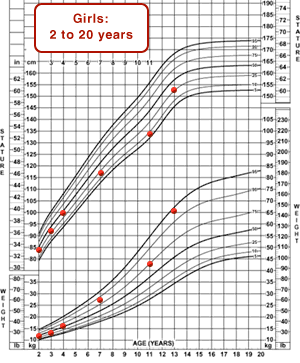
When assessing physical growth, it is desirable to have a series of accurate measurements to monitor a child’s growth pattern over time. BMI is a useful tool that triggers assessment; however, other clinical information, such as a review of the patient’s family and medical histories, a review of the BMI trajectory, an assessment of body fat distribution, diet and activity habits, and appropriate laboratory tests, influences the need for intervention (Barlow, 2007).To obtain a clear understanding of the growth pattern observed on the BMI-for-age chart, plot the weight-for-age and stature-for-age charts to determine the pattern of weight and stature separately.
Examples:
Angelica
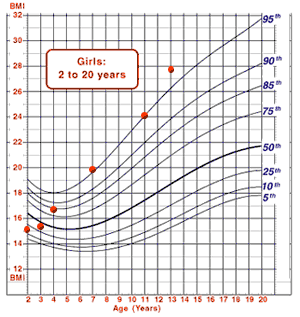
 Angelica is a 13-year-old girl with intermittent weight and height measurements since age 2. Her measurements have been plotted on the BMI-for-age, weight-for-age, and stature-for-age charts.
| Age | Weight | Stature | BMI |
|---|---|---|---|
| 2 | 23 1/4 | 33 | 15 |
| 3 | 28 1/2 | 36 1/4 | 15.2 |
| 4 | 36 1/2 | 39 1/4 | 16.7 |
| 7 | 60 | 46 | 19.9 |
| 11 | 94 1/2 | 52 1/2 | 24.1 |
| 13 | 143 | 60 1/4 | 27.7 |
 The BMI-for-age chart shows a steady increase in BMI-for-age from age 2 to 4 years. By age 7, Angelica's BMI-for-age was slightly above the 95th percentile, and it remains in this channel or above to the present, indicating that she is classified as obese. Her stature-for-age has consistently been below the 50th percentile, whereas after age 3, her weight has been consistently above the 50th percentile, and at age 13 years, it is above the 90th percentile. We see that Angelica is slightly shorter than other girls her age, whereas her weight is higher.
BMI values that fall outside the established parameters, the 5th and 95th percentiles, suggest the need to recheck measurements, plots, and calculations, and make any necessary corrections or adjustments. If measurements are correct, BMI classification needs to be integrated with other information, such as the growth pattern, familial obesity, and medical risks to assess the child’s health risk (Barlow, 2007).
Providers may refer to the following resources for more information about the prevention, assessment, and treatment of overweight and obesity among children and teens.
- The U.S. Preventive Services Task Force recommendation on Screening for Obesity in Children and Adolescents (2010). http://www.uspreventiveservicestaskforce.org/uspstf/uspschobes.htm
- The Expert Committee Recommendations Regarding the Prevention, Assessment, and Treatment of Child and Adolescent Overweight and Obesity: Summary Report (Barlow, 2007).
- The Recommendations for Treatment of Child and Adolescent Overweight and Obesity (Spear et al., 2007).
- The American Academy of Pediatrics About Childhood Obesity Web site. http://www2.aap.org/obesity/about.html.
- The American Academy of Pediatrics Web-based portal, provides pediatricians and other health care providers with the latest clinical information, as well as tools and resources to support health care professionals in effectively addressing obesity prevention, assessment, and treatment at the point of care. http://www2.aap.org/obesity/practice_management_resources.html
- Page last reviewed: May 9, 2014
- Page last updated: May 9, 2014
- Content source:


 ShareCompartir