

Case Example 1: Low Weight-for-Length
 ShareCompartir
Maya is a healthy 9-month-old girl who was exclusively breastfed for 6 months and continues to breastfeed. Maya's mother began feeding her solid foods at 6 months of age. Maya's mother reports that Maya “is a good eater”.
Maya has seen her health care provider on a regular basis. Her weight and length measurements were recorded and plotted on the growth chart at each visit.
| Date | Age (months) | Weight (pounds) | Length (inches) |
|---|---|---|---|
| 11/14/2009 | Birth | 6.25 | 20 |
| 1/14/2010 | 2 | 9.25 | 22.25 |
| 3/19/2010 | 4 | 12.25 | 24.6 |
| 5/17/2010 | 6 | 13.75 | 25.75 |
| 8/21/2010 | 9 | 16.0 | 28.0 |
Comparing Length-for-Age and Weight-for-Age Plotted on the WHO and CDC Growth Charts
Length-for-age and weight-for-age are important in early infancy for monitoring growth and helping to explain changes in weight-for-length.
Using the WHO and CDC Length-for-Age and Weight-for-Age Growth Charts
Maya's length and weight measurements are plotted on the WHO and the CDC length-for-age and the weight-for-age charts. On the WHO and the CDC length-for-age charts, Maya's length follows a centile curve and shows that her length relative to her age is within the healthy range. On the WHO and the CDC weight-for-age chart, Maya's weight follows a centile curve and shows that her weight relative to her age is within the healthy range.
- See Maya's measurements plotted on the WHO length-for-age and weight-for-age growth chart.
- See Maya's measurements plotted on the CDC length-for-age and weight-for-age growth chart.
| Comparing Weight-for-Length Plotted on the WHO and CDC Growth Charts | |
|---|---|
WHO Weight-for-Length Growth Chart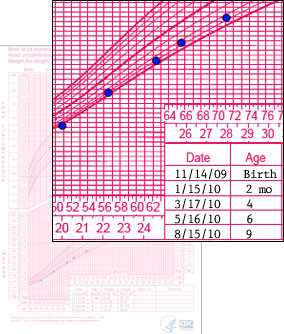 | CDC Weight-for-Length Growth Chart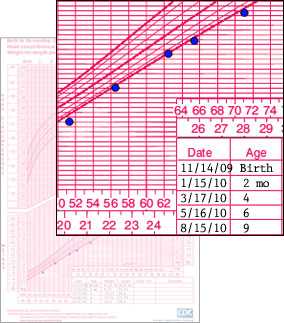 |
Using the CDC Weight-for-Length Growth Chart
When Maya's weight-for-length measurements are plotted on the CDC growth charts, her growth pattern falls below the 5th percentile curve for the first 9 months of age.
Comment: On the WHO weight-for-length chart Maya's measurements fall above the 2nd percentile, which is within a healthy range. On the CDC weight-for-length chart Maya's growth drops to below the 5th percentile, which indicates low weight-for-length. Fewer children will be identified as low weight-for-length on the WHO charts resulting in potentially fewer children being referred for additional assessments.
- Page last reviewed: April 15, 2015
- Page last updated: April 15, 2015
- Content source: