MMWR Data Highlights
What is added by this report?
Download MMWR Data Highlights
Overall, 27.5% of adults age 50 years and older were inactive. Inactivity prevalence significantly increased with increasing age for adults 50-64 years (25.4%), 65-74 years (26.9%), and 75 years and older (35.3%). Inactivity prevalence was significantly higher for women, Hispanics and non-Hispanic blacks, and adults with ≥1 chronic disease than their counterparts. Inactivity prevalence significantly increased with decreasing levels of education and increasing body mass index.
What are the implications for public health practice?
Despite the many benefits of being physically active, approximately 1 in 4 adults 50 years and older are inactive. Communities can be designed and enhanced to make it safer and easier for people of all ages and abilities to be physically active.
| Table 1. Self-reported prevalence of inactivity among adults 50 years and older by selected characteristics — Behavioral Risk Factor Surveillance System, 2014* | ||
|---|---|---|
| Sex | Male | 25.5% |
| Female | 29.4% | |
| Age Group (years) | 50-64 | 25.4% |
| 65-74 | 26.9% | |
| >75 | 35.3% | |
| Race/Ethnicity | White, non-Hispanic | 26.2% |
| Black, Non-Hispanic | 33.1% | |
| Hispanic | 32.7% | |
| Other§ | 27.1% | |
| Education | <High school graduate | 44.1% |
| High school graduate | 34.7% | |
| Some college | 24.6% | |
| College graduate | 14.2% | |
| Body Mass Index¶ (kg/m2) | Underweight/Normal weight | 23.1% |
| Overweight | 24.4% | |
| Obese | 35.8% | |
| Region | Midwest | 28.4% |
| Northeast | 26.6% | |
| South | 30.1% | |
| West | 23.1% | |
* Inactivity is defined as responding "No" to the following question: "During the past month, other than your regular job, did you participate in any physical activities or exercises such as running, calisthenics, golf, gardening, or walking for exercise?"
§ Other includes Multi-Racial, Asian, Native Hawaiian or Other Pacific Islander, or American Indian, Alaska Native
¶ Body mass index (BMI) classifications are as follows: Underweight/Normal (< 25.0 kg/m2); Overweight (25.0-29.9 kg/m2); Obese (≥ 30 kg/m2)
| Table 2. Self-reported prevalence of inactivity among adults 50 years and older by chronic disease — Behavioral Risk Factor Surveillance System, 2014* | ||
|---|---|---|
| Arthritis | Yes | 33.1% |
| No | 23.3% | |
| Cancer** | Yes | 31.6% |
| No | 27.0% | |
| Coronary heart disease† | Yes | 37.2% |
| No | 26.1% | |
| COPD | Yes | 44.4% |
| No | 25.6% | |
| Depressive disorder | Yes | 38.0% |
| No | 25.2% | |
| Diabetes | Yes | 38.4% |
| No | 25.1% | |
| Stroke | Yes | 42.9% |
| No | 26.7% | |
* Inactivity is defined as responding "No" to the following question: "During the past month, other than your regular job, did you participate in any physical activities or exercises such as running, calisthenics, golf, gardening, or walking for exercise?"
** Excluding skin cancer
† Coronary heart disease includes myocardial infarction and coronary heart disease
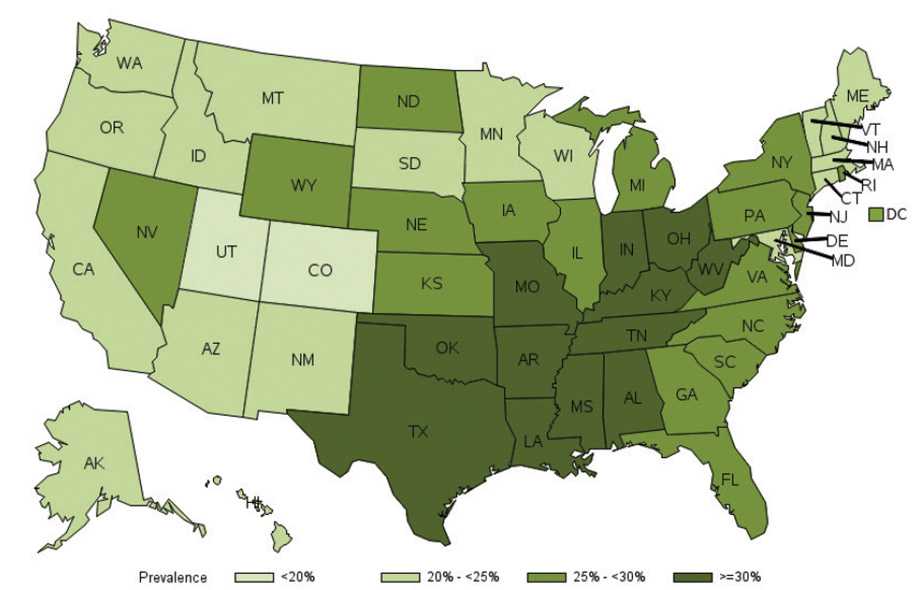
Figure 1. Prevalence of self-reported physical inactivity among adults 50 years and older — Behavioral Risk Factor Surveillance System 2014

Table 3. Self-reported prevalence of inactivity among adults 50 years and older by state — Behavioral Risk Factor Surveillance System, 2014*
| States | Prevalence of Inactivity (%) |
|---|---|
| Alabama | 32.3 |
| Alaska | 22.9 |
| Arizona | 24.3 |
| Arkansas | 38.8 |
| California | 24.4 |
| Colorado | 17.9 |
| Connecticut | 24.4 |
| Delaware | 28.7 |
| District of Columbia | 25.7 |
| Florida | 26.5 |
| Georgia | 28.7 |
| Hawaii | 23.5 |
| Idaho | 21.2 |
| Illinois | 27.7 |
| Indiana | 30.6 |
| Iowa | 28.7 |
| Kansas | 29.8 |
| States | Prevalence of Inactivity (%) |
|---|---|
| Kentucky | 34.8 |
| Louisiana | 34.0 |
| Maine | 23.9 |
| Maryland | 24.9 |
| Massachusetts | 23.5 |
| Michigan | 29.4 |
| Minnesota | 23.8 |
| Mississippi | 35.6 |
| Missouri | 31.1 |
| Montana | 24.1 |
| Nebraska | 25.5 |
| Nevada | 27.9 |
| New Hampshire | 23.2 |
| New Jersey | 25.9 |
| New Mexico | 24.8 |
| New York | 28.5 |
| North Carolina | 27.7 |
| States | Prevalence of Inactivity (%) |
|---|---|
| North Dakota | 27.3 |
| Ohio | 30.2 |
| Oklahoma | 34.8 |
| Oregon | 20.2 |
| Pennsylvania | 27.5 |
| Rhode Island | 25.6 |
| South Carolina | 29.4 |
| South Dakota | 24.4 |
| Tennessee | 33.3 |
| Texas | 31.4 |
| Utah | 19.9 |
| Vermont | 22.3 |
| Virginia | 28.4 |
| Washington | 20.0 |
| West Virginia | 33.7 |
| Wisconsin | 24.1 |
| Wyoming | 26.3 |
* Inactivity is defined as responding "No" to the following question: "During the past month, other than your regular job, did you participate in any physical activities or exercises such as running, calisthenics, golf, gardening, or walking for exercise?"
- Page last reviewed: September 15, 2016
- Page last updated: September 15, 2016
- Content source:


 ShareCompartir