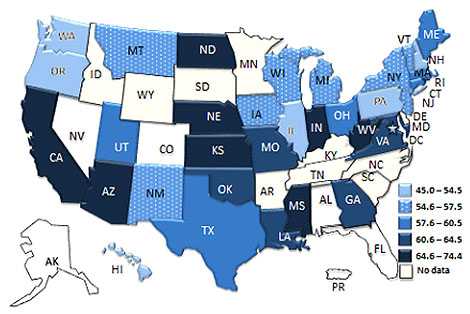
Asthma Severity among Children with Current Asthma
Asthma severity determines type and duration of treatment
Percentage with Persistent Severity

Asthma severity* is the inherent intensity of the disease process. Disease progression and symptoms vary among individuals and within an individual’s experience over time. The population-based asthma severity prevalence estimate depends on whether the individual is treated or not and how well the individual responds to the treatment. Intermittent severity includes people who are well-controlled without long-term control medication. Persistent severity includes people who are on long-term control medications and people with uncontrolled asthma (not well-controlled or very poorly controlled) who are not on long-term control medication. Nearly 60% of children with current asthma† have persistent asthma; 40% have intermittent asthma.
Intermittent and persistent asthma prevalence among children varied by state during the years 2006-2010, but did not follow a specific geographic pattern. Intermittent asthma prevalence ranged from 25.6% in Mississippi to 55.0% in Oregon (See table). Persistent asthma prevalence ranged from 45.0% in Oregon to 74.4% in Mississippi (See map for details).
CDC’s National Asthma Control Program was created in 1999 to help the millions of people with asthma in the United States control their disease. The Program conducts national asthma surveillance and provides funds to states to help improve asthma surveillance and focus efforts and resources where they are needed.
*National Asthma Education and Prevention Program Expert panel report 3: Guidelines for the Diagnosis and Management of Asthma, 2007. Available at: http://www.nhlbi.nih.gov/guidelines/asthma/asthgdln.pdf [PDF - 3.88 MB]. †Includes persons who answered “yes” to the questions: “Have you ever been told by a doctor, nurse, or other health professional that you had asthma?” and “Do you still have asthma?”
Source: Behavioral Risk Factors Surveillance System (BRFSS)—Adult Asthma Call-back survey Data, 2006-2010
Download this AsthmaStats Factsheet [PDF - 204 KB] containing additional information.
| STATE | Intermittent Severity% | Persistent Severity% |
|---|---|---|
| U.S. Total** | 39.7 | 60.3 |
| AZ | 33.0 | 67.0 |
| CA | 32.5 | 67.5 |
| CT | 40.5 | 59.5 |
| DC | 46.9 | 53.1 |
| GA | 36.4 | 63.6 |
| HI | 52.6 | 57.4 |
| IL | 46.4 | 53.6 |
| IN | 34.9 | 65.1 |
| IA | 43.5 | 57.5 |
| KS | 33.7 | 66.3 |
| LA | 36.4 | 63.6 |
| ME | 39.8 | 60.2 |
| MD | 38.6 | 61.4 |
| MA | 40.2 | 59.8 |
| MI | 39.7 | 60.3 |
| MS | 25.6 | 74.4 |
| MO | 37.0 | 63.0 |
| MT | 43.4 | 56.6 |
| NE | 34.9 | 65.1 |
| NH | 50.6 | 49.4 |
| NJ | 42.5 | 57.5 |
| NM | 43.6 | 56.4 |
| NY | 42.6 | 57.4 |
| ND | 34.8 | 65.2 |
| OH | 39.8 | 60.2 |
| OK | 39.3 | 60.7 |
| OR | 55.0 | 45.0 |
| PA | 47.2 | 52.8 |
| RI | 37.0 | 63.0 |
| TX | 39.5 | 60.5 |
| UT | 42.2 | 57.8 |
| VT | 42.5 | 57.5 |
| VA | 38.8 | 61.2 |
| WA | 53.3 | 46.7 |
| WV | 32.7 | 67.3 |
| WI | 43.7 | 56.3 |
- Page last reviewed: February 17, 2015
- Page last updated: March 30, 2015
- Content source:


 ShareCompartir